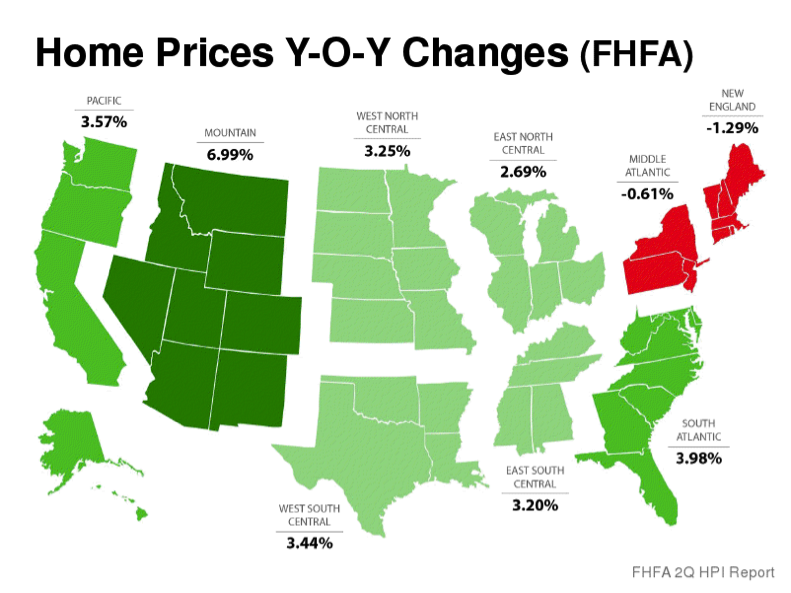
As we continue to watch the market, we have a building body of evidence that the housing market is continuing to improve with extremely positive signs that the worst is over. Those markets hardest hit, such as California, Nevada and Florida showing the strongest signs of improvement… Even those trailing markets, which Alabama is a part, are also showing positive gains when comparing sale prices year-over-year. Only the North East continues to experience that dangerous average decreases in sales prices.
Remember “averages” can be misleading, as they don’t describe all markets within an area. Even so, there is no denying this improving market.
I have previously reported here that the Birmingham market has seen a 20% reduction in available inventory and a 9% increase in demand, which has resulted in an increase in the 2.5 – 4% increase in year-over-year prices.
Using the FHFA (Federal Housing Finance Agency) data for the state of Alabama, we see an increase of just over 4% from the second quarter of 2011 to the second quarter of 2012 (the most recently published data). Meaning a house purchased during the second quarter of 2011 at a price of $100,000 had a value of $104,052 in the second quarter of 2012.
This would be a strong indicator that the bottom has passed…as prices are on the rise. So a word to the wise buyer… prices are unlikely to go lower… watch the interest rates closely… the are currently at historic lows just above 3.25% for those with good credit on a 30 year mortgage. A rise to 4% for the same loan would be the same thing as an increase of about 15% in purchase price.
An important note for Sellers… While this turnaround in certainly good news, you should be aware we are still a long way from 2006 prices. A home purchased at $100,000 in the second quarter of 2006 had a value of $94,111 in the second quarter of 2012. The chart below shows home values over time beginning with a purchase price of $100,000 in the second quarter of 2006 ending the second quarter of 2012 (Source FHFA Home Price Index 2nd Quarter 2012 Data).

So when do we return to 2006 pricing levels? Barclay’s forecast 2021, while Fiserv forecast 2023. Coincidentally, these are very much in line with my forecast made 4 years ago that we would not see 2006 pricing before 2020.
May the Market be with you.


